See a sample reportYour numbers, every month, on one page you can use.
Every client gets a live dashboard like this after each month-end close, built from their own QuickBooks and checked before it goes out. The company below is invented, so you can see the shape of the report. We walk through the full, working version with you on a call.
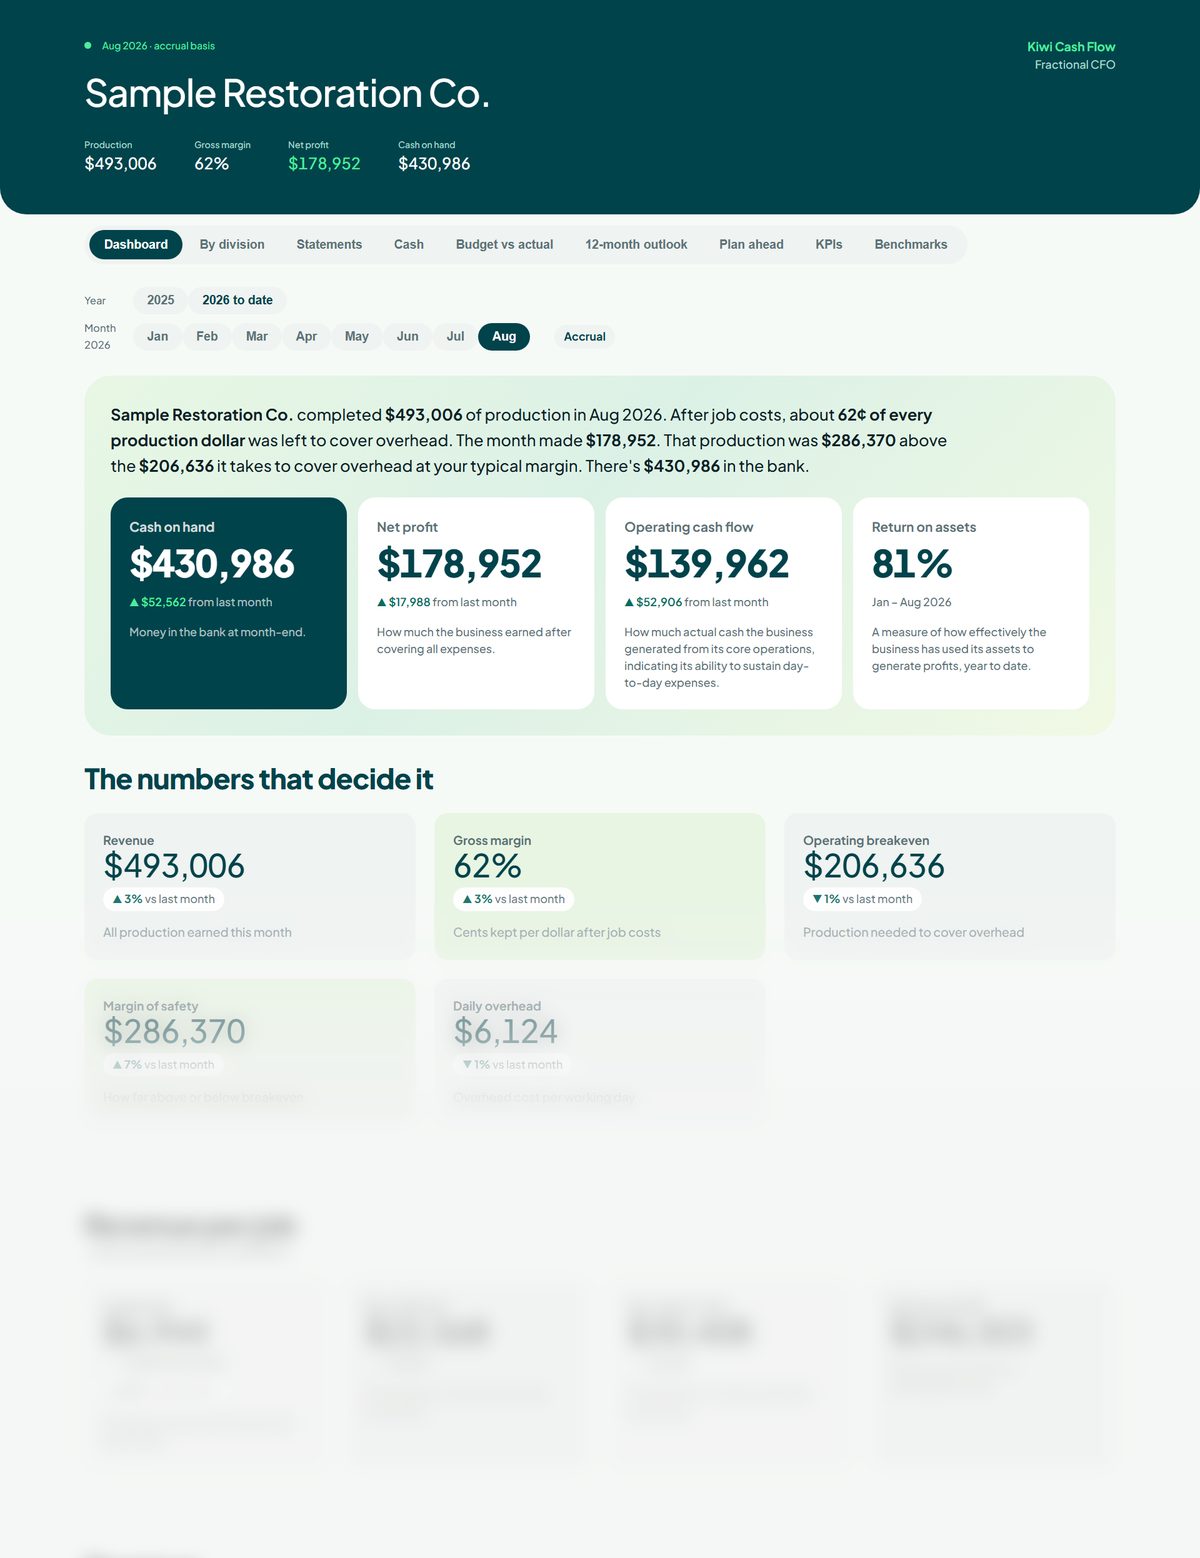
The month on one page
What you produced, what you kept after job costs, what you made and what is in the bank, in a sentence you can read in ten seconds. Then the handful of numbers that decide the month: your breakeven, your margin of safety and what a day of overhead costs you.
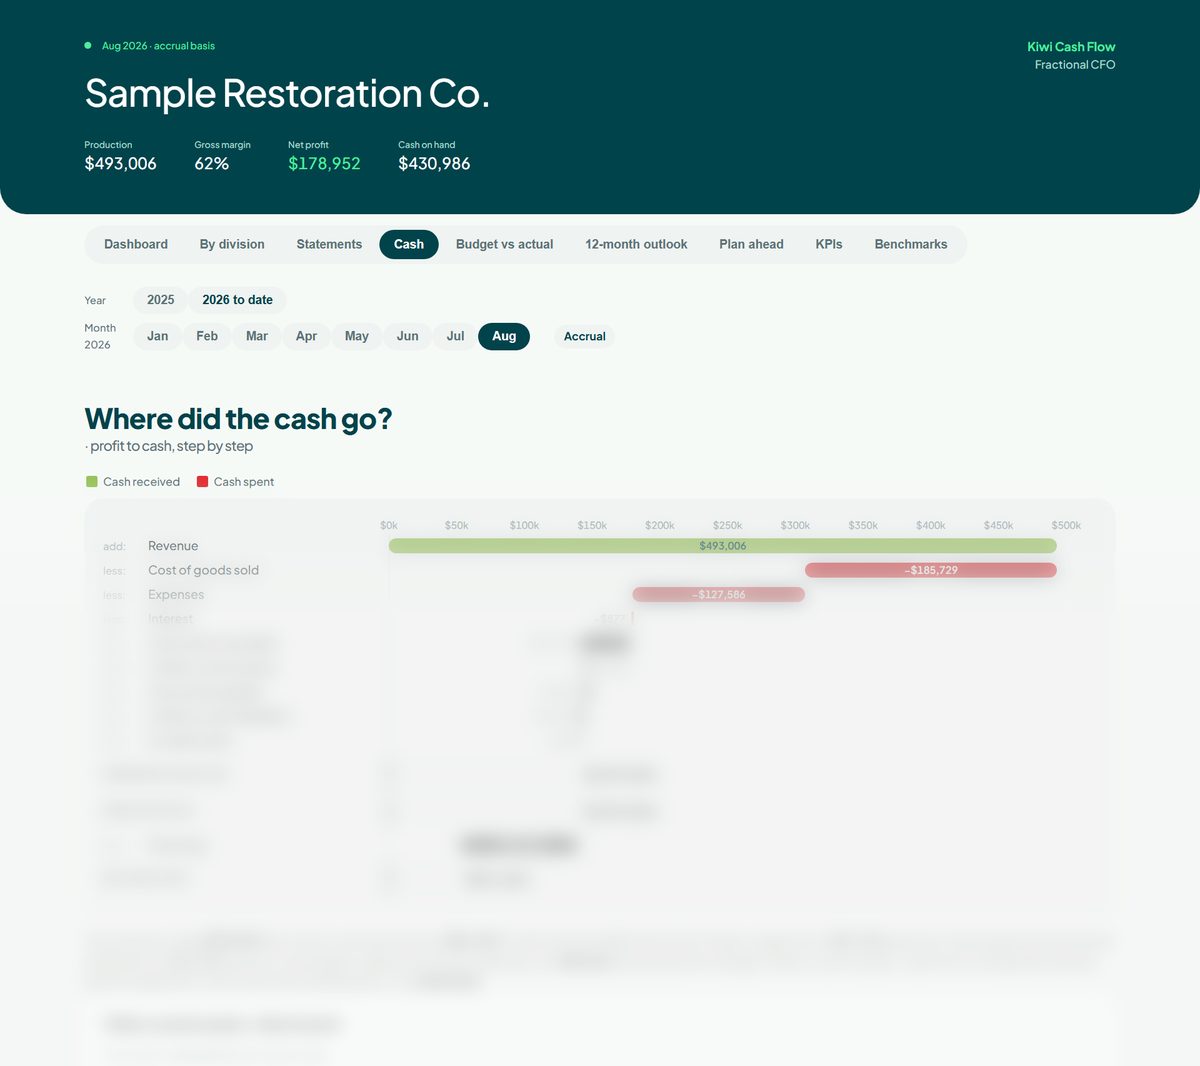
Where did the cash go?
Profit and cash are not the same thing, and this is the page that shows why. It walks from revenue to the change in your bank balance step by step, names the biggest reasons they differ, and lists the accounts that moved.
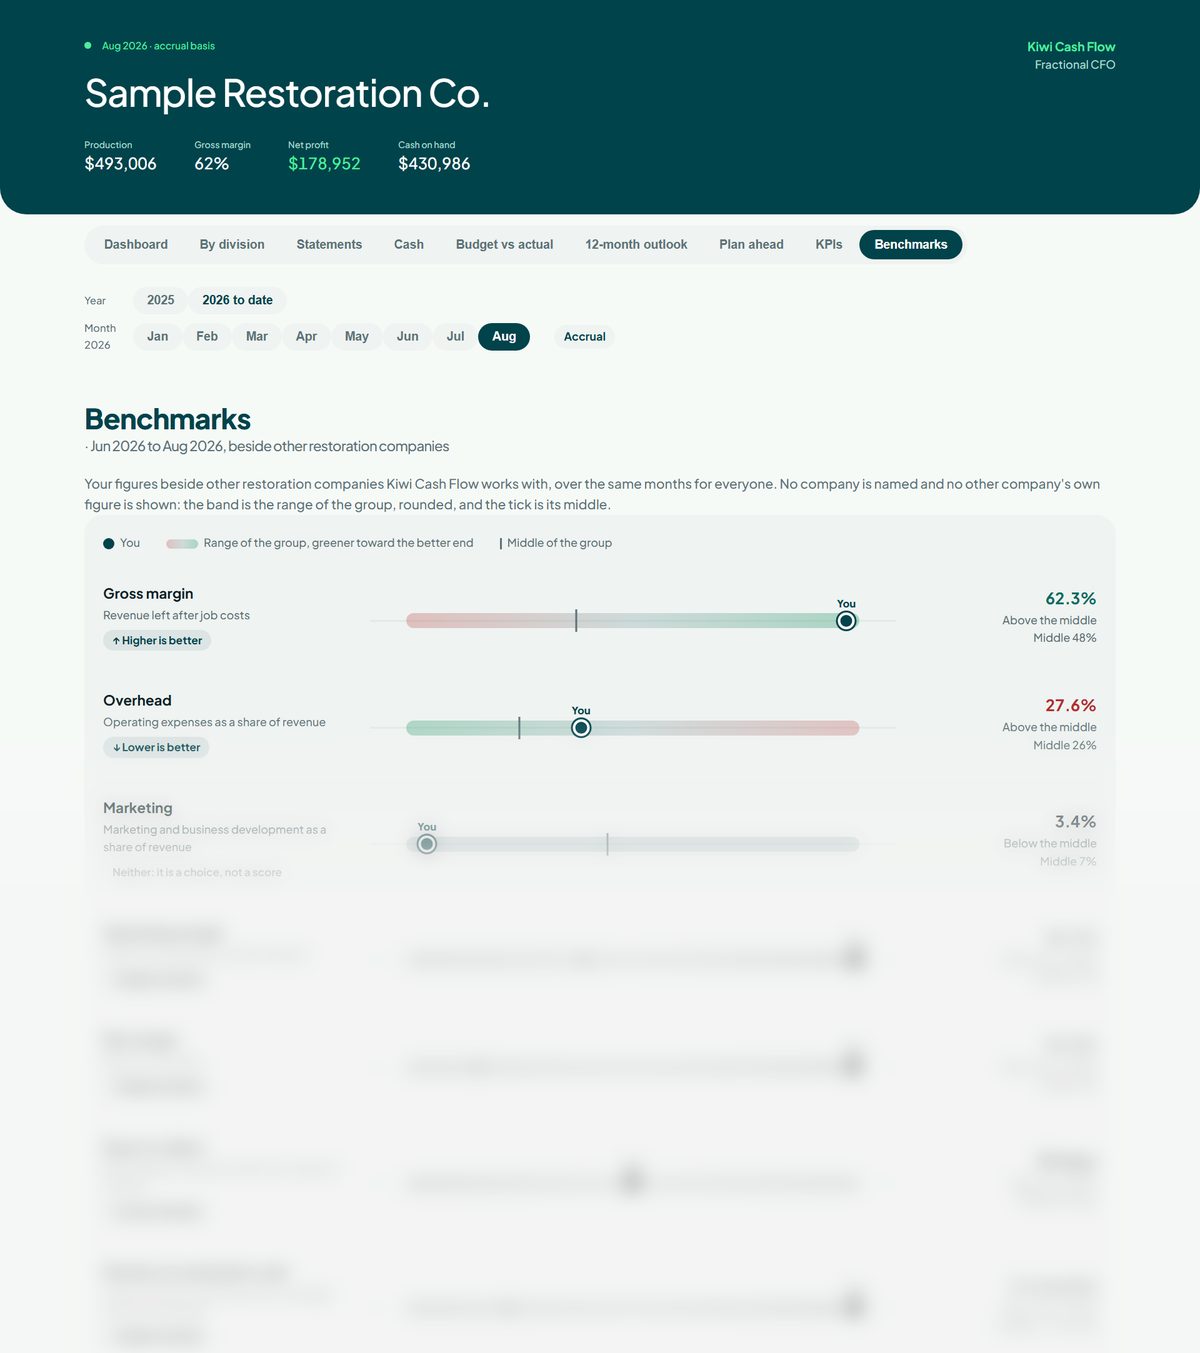
How you compare
Your margins, overhead, days to collect and cash cushion beside other restoration companies, anonymously. Each measure says which way is better, so you can see at a glance where you lead and where there is room to improve.
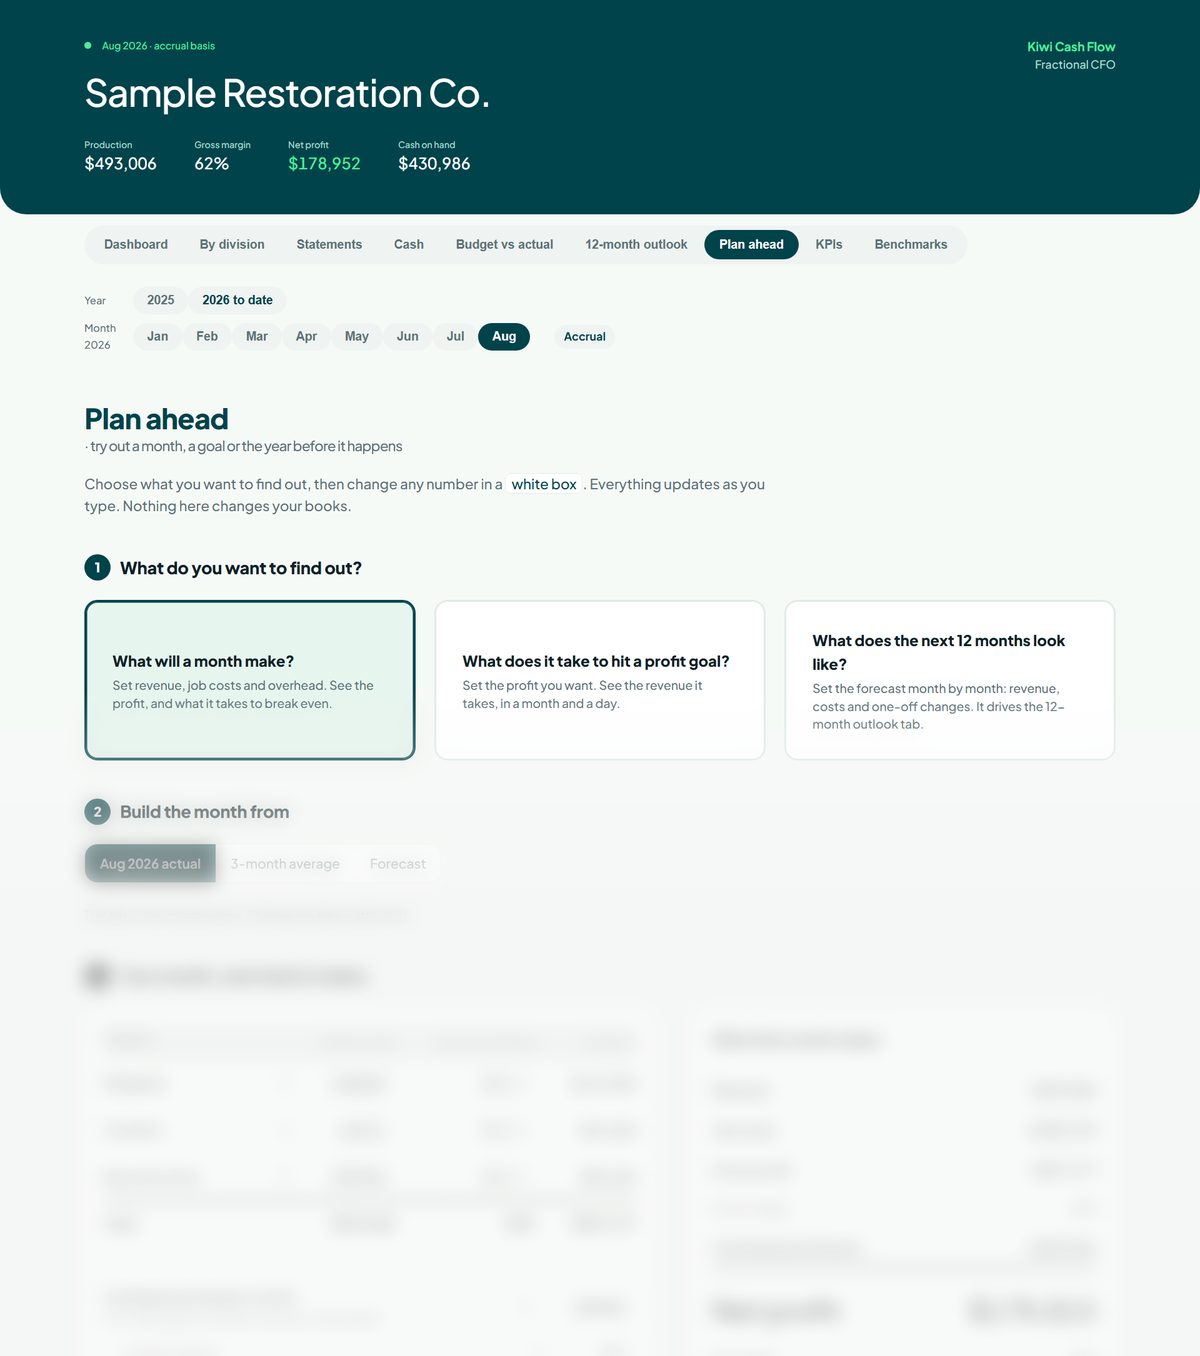
Try a decision before you make it
Ask what a month will make, what it takes to hit a profit goal, or what the next twelve months look like. Change a number and everything updates, by division, down to the jobs a month it takes.
See the whole report, working
On a short call we open the full dashboard, click through every tab, and talk about what yours would show.
Sample Restoration Co. is an invented company. No client's figures appear on this page.